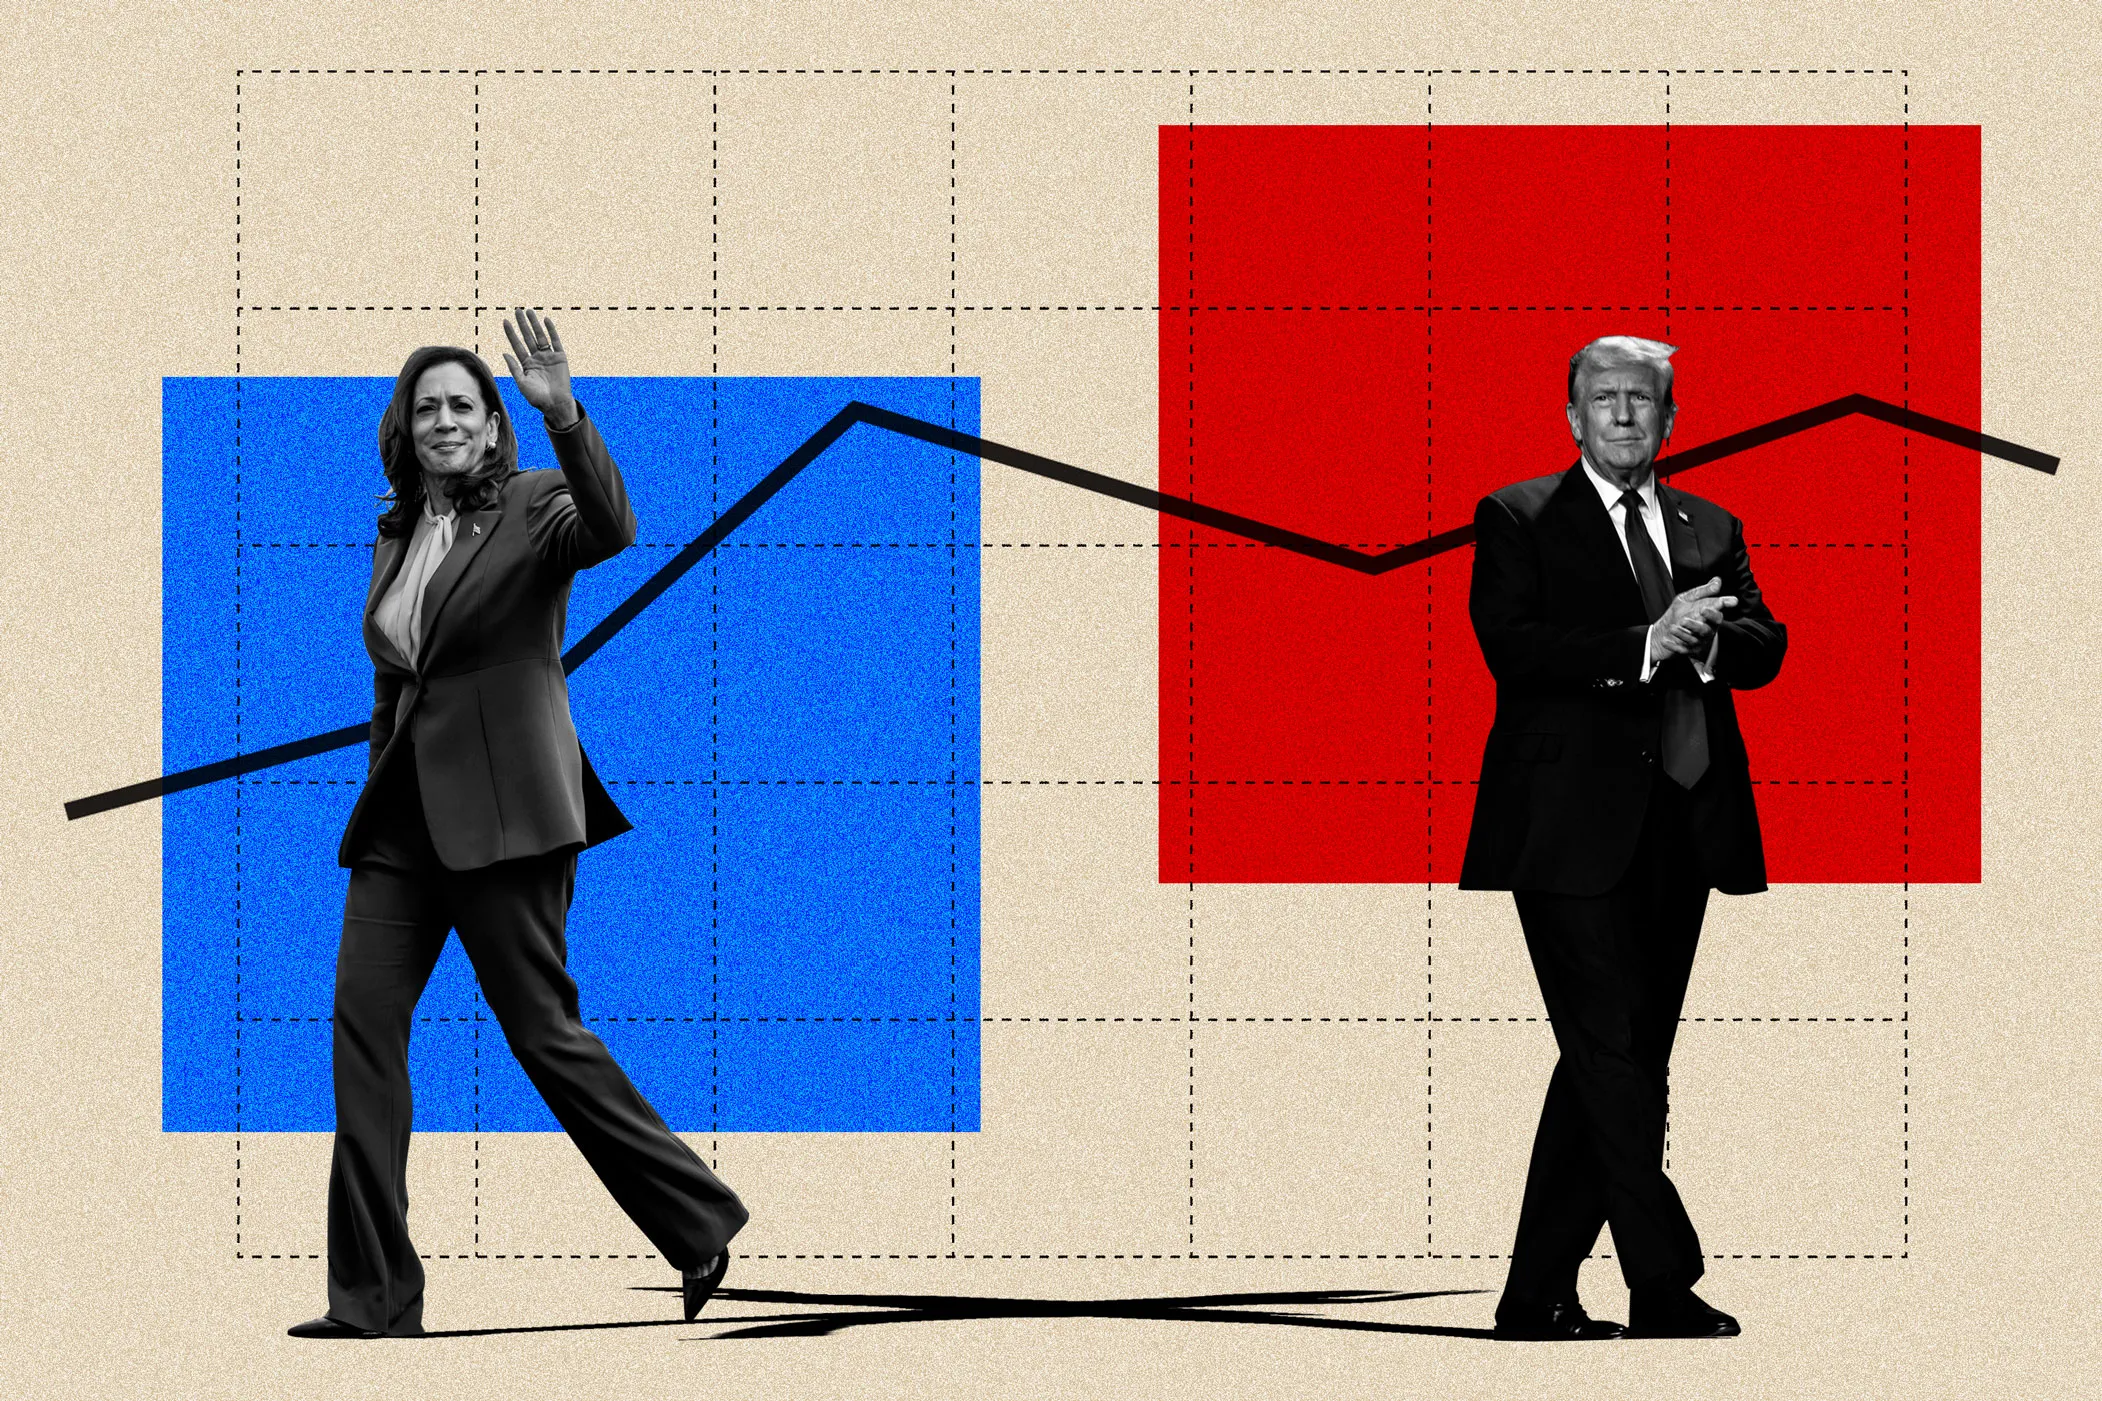
The U.S. is just 82 days away from the 2024 presidential election. And as polls, pundits and prognosticators continue their attempts at predicting whether Vice President Kamala Harris or former President Donald Trump will take the White House, there’s one indicator that’s proven to be a very accurate barometer: the stock market.
Political analysts and pollsters often rely on other measures of the economy, like gas prices, unemployment and inflation, to forecast election outcomes. But for more than 90 years, the market’s performance has been highly correlated with who ultimately occupies 1600 Pennsylvania Avenue.
The stock market’s track record of predicting election winners
In the lead-up to Election Day, the performance of the S&P 500 — the benchmark index synonymous with the stock market — has accurately predicted the winner of the U.S. presidential election 83% of the time, according to research conducted by LPL Financial Holdings, the largest financial advisory firm in the U.S.
Since 1928, the incumbent party remained in control of the White House in 12 out of the 15 elections when the S&P 500 was positive during the three months leading up to an election. On the flip side, the incumbent party lost the election eight out of the last night times when market returns fell in the three months before an election.
“When combined, market performance has ‘predicted’ 20 of the last 24 elections,” Adam Turnquist, chief technical analyst at LPL Financial, wrote.
Historically, the S&P 500 has not posted its strongest 90-day performance of the year leading up to Election Day. Based on data from 1950 through 2023, here are the average monthly returns during that period:
- August: -0.20%
- September: -0.87%
- October: 0.75%
Cumulatively, those three months have an average return of -0.32%. The market’s strongest three months from 1950 to 2023 are November (1.63%), April (1.45%) and December (1.36%).
However, in any given year, market conditions, investor sentiment and economic factors can vary widely. Therefore, historical performance — while providing context — is not the best indicator of how the S&P 500 will perform on a year-by-year or month-by-month basis.
Exceptions to the rule
The four anomalies indicated in LPL Financial’s research can in part be attributed to economic and political circumstances particular to those election cycles.
1956: When President Eisenhower won re-election despite the S&P 500 falling -3.2% in the three months preceding Election Day, he was riding a 78% approval rating, according to Cornell University’s Roper Center for Public Opinion Research. This was largely based on record employment, high wages and stable prices.
1968: President Nixon narrowly defeated incumbent Vice President Hubert Humphrey in a year that saw three candidates on the ballot, with Democrat George Wallace running as an Independent and receiving a sizable 13.5% of the popular vote. Nixon managed a 0.7% margin of victory over Humphrey, who took the party’s nomination in the wake of Robert F. Kennedy’s assassination. The S&P 500 gained 6% in the lead-up to that year’s election.
1980: When President Regan supplanted President Carter, 1979’s oil crisis was fresh in voters’ minds and inflation — at 13.5% — was the highest since 1947. The stock market gained 6.9% in the 90 days before the election.
2020: After the brief pandemic-induced bear market, the S&P 500 returned 2.3% in the three months prior to Election Day. Despite the market rebound, President Trump’s approval rating dipped below 30%, unemployment was as high as 8.4% in the weeks leading up to the election and a record number of Americans voted.
The outlook for 2024
There is no crystal ball showing who will win the election this November, and polls have proven to be unreliable gauges. Likewise, basing outcomes on the stock market’s short-term performance is hardly a perfect science.
We’re now two weeks into that crucial 90-day window before the election, and so far, it’s been a bumpy ride. After the S&P 500 reached its all-time high in mid-July, a sell-off resulted in the market falling by over -8%.
But since Aug. 5, the benchmark index has recovered more than 5%. This heightened volatility has contributed to a murkier outlook over the next three months.
Before 2020, the stock market correctly called the outcome of the previous nine presidential elections. Will its penchant for political predictions return this year? We’ll know for sure on Tuesday, Nov. 5.
More from Money:
Stock Market Sell-off: Why Investors Shouldn’t Panic About Monday’s ‘Crash’
Analysts Predict These 3 Stock Market Sectors Will Finish 2024 Strong
5 Best Stock Trading Apps of 2024
